Compare clusters
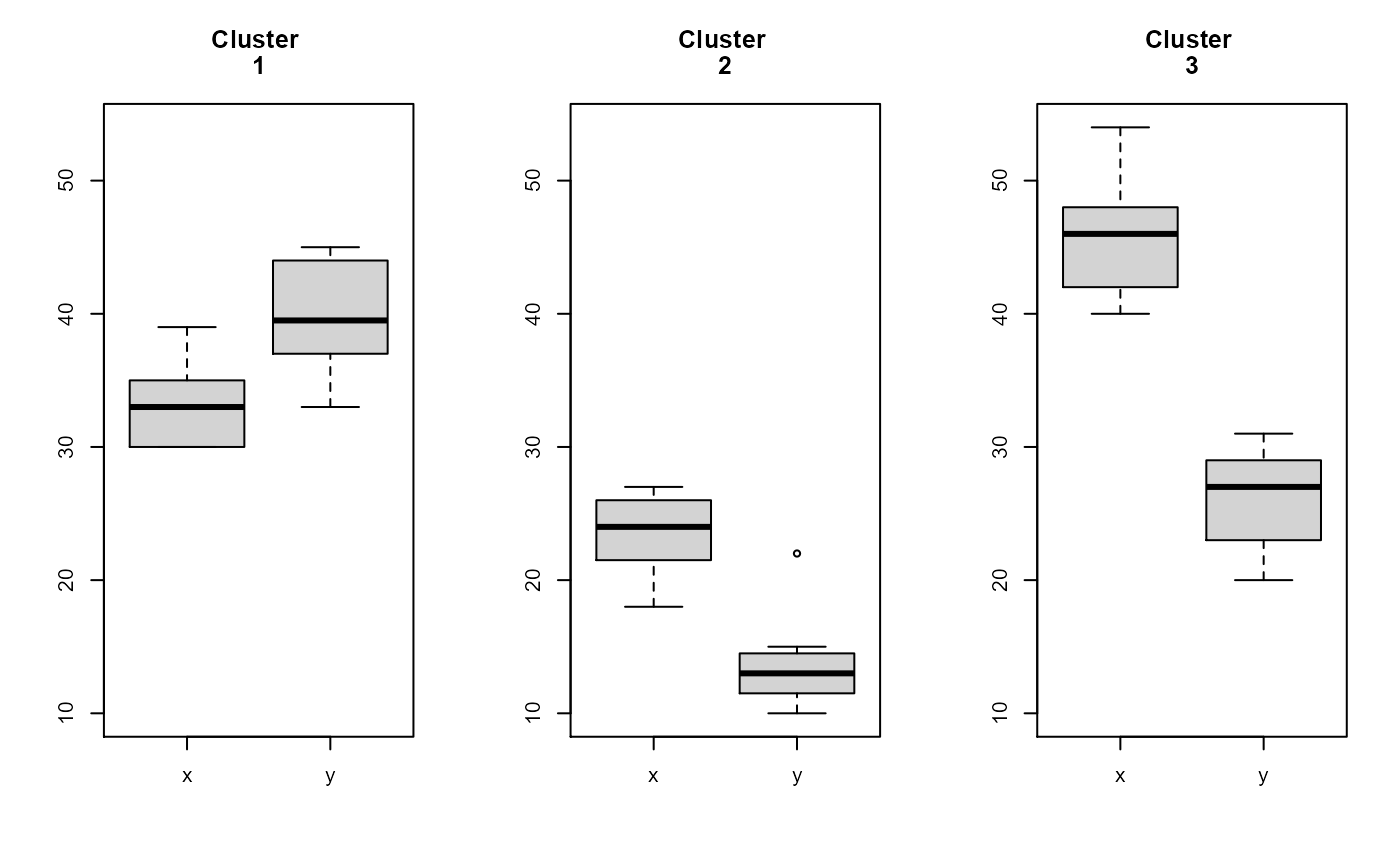
generate.plots.comparing.clusters.RdFor each cluster as specified by rows.for.each.cluster, box plots are generated for each column as specified in name.of.values.to.compare.
generate.plots.comparing.clusters(
  data.input,
  rows.for.each.cluster,
  name.of.values.to.compare
)
Arguments
| data.input | A dataframe |
|---|---|
| rows.for.each.cluster | A numerical vector that indicates which cluster each observation (row in data.input) belongs to |
| name.of.values.to.compare | A vector of strings that indicates the columns in the data.input that should be |
Value
No objects are returned, but a plot will be outputted.
See also
Other Clustering functions:
CalcOptimalNumClustersForKMeans(),
GenerateParcoordForClusters(),
HierarchicalClustering(),
generate.2D.clustering.with.labeled.subgroup(),
generate.3D.clustering.with.labeled.subgroup()
Examples
example.data <- data.frame(x = c(18, 21, 22, 24, 26, 26, 27, 30, 31, 35, 39, 40, 41, 42, 44, 46, 47, 48, 49, 54, 35, 30), y = c(10, 11, 22, 15, 12, 13, 14, 33, 39, 37, 44, 27, 29, 20, 28, 21, 30, 31, 23, 24, 40, 45)) #dev.new() plot(example.data$x, example.data$y)km.res <- stats::kmeans(example.data[,c("x", "y")], 3, nstart = 25, iter.max=10) grouped <- km.res$cluster generate.plots.comparing.clusters(example.data, grouped, c("x", "y"))