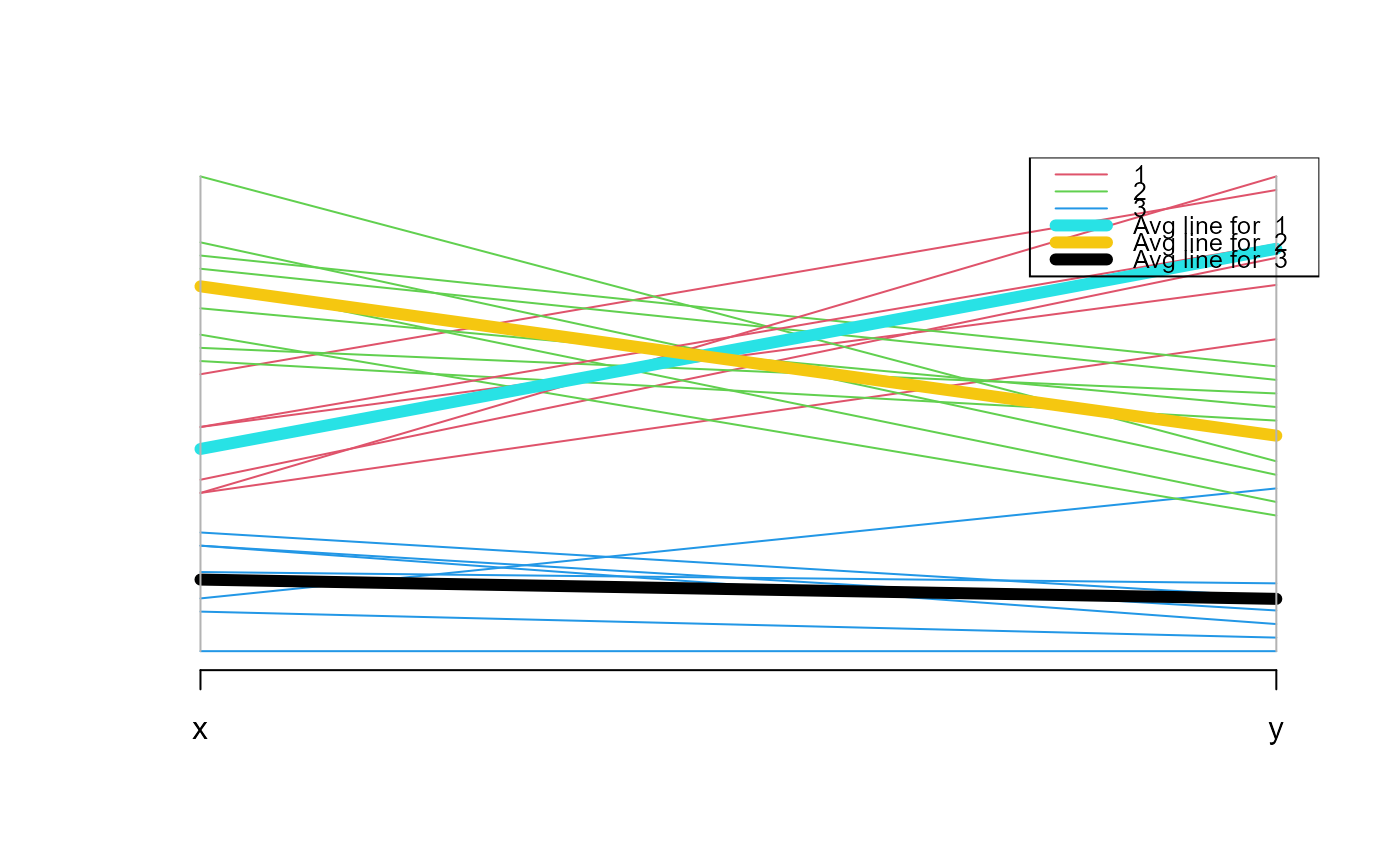
Generate parallel plot to show each observation and which cluster they belong in.
GenerateParcoordForClusters.RdGenerate parallel plot to show each observation and which cluster they belong in.
GenerateParcoordForClusters(
  inputted.data,
  cluster.assignment.column,
  x_axis_features
)
Arguments
| inputted.data | A dataframe where there are numerical columns for clustering. |
|---|---|
| cluster.assignment.column | A string that specifies the name of the column in inputted.data that specify which cluster each observation in inputted.data belongs to. |
| x_axis_features | A vector of strings that specify which features from inputted.data should be displayed on the x-axis of the parallel plot. |
Value
No object is returned but a plot will be created.
See also
Other Clustering functions:
CalcOptimalNumClustersForKMeans(),
HierarchicalClustering(),
generate.2D.clustering.with.labeled.subgroup(),
generate.3D.clustering.with.labeled.subgroup(),
generate.plots.comparing.clusters()
Examples
example.data <- data.frame(x = c(18, 21, 22, 24, 26, 26, 27, 30, 31, 35, 39, 40, 41, 42, 44, 46, 47, 48, 49, 54, 35, 30), y = c(10, 11, 22, 15, 12, 13, 14, 33, 39, 37, 44, 27, 29, 20, 28, 21, 30, 31, 23, 24, 40, 45)) #dev.new() plot(example.data$x, example.data$y)km.res <- stats::kmeans(example.data[,c("x", "y")], 3, nstart = 25, iter.max=10) grouped <- km.res$cluster example.data <- cbind(example.data, grouped) GenerateParcoordForClusters(example.data, "grouped", c("x", "y"))