Find averaged xy plots
MakeCompositeXYPlotForAllWindows.RdIf there are multiple 2D plots where the range of the x values are the same, then this function can allow you to average the y-values for all of these plots. The increment of the x-values can be different because this function uses interpolation to ensure each window has the same x-axis when the averaging step occurs.
MakeCompositeXYPlotForAllWindows(
  list.of.windows,
  name.of.col.containing.time.series,
  x_start = 0,
  x_end,
  x_increment
)
Arguments
| list.of.windows | A list of windows (dataframes). Each window should have the same range of values in the x-axis in order for averaging to work. |
|---|---|
| name.of.col.containing.time.series | A string that specifies the name of the column in the windows that correspond to the time series that should be used for making averaging. |
| x_start | Numeric value specifying start of the new x-axis for the averaged PSD. Default is 0, so the first observation in the time series corresponds with x = 0. |
| x_end | Numeric value specifying end of the new x-axis for the averaged PSD. Maximum value is the sampling_frequency divided by 2. |
| x_increment | Numeric value specifying increment of the new x-axis for the averaged PSD. |
Value
Vector of x values for plotting. The units will be number of observations. So if the time series has 100 observations and x_increment used is 1, then each tick mark on the x-axis corresponds to one observation unit.
Vector of averaged y values after looking at all windows.
Vector of standard deviation of y values for each x value.
Examples
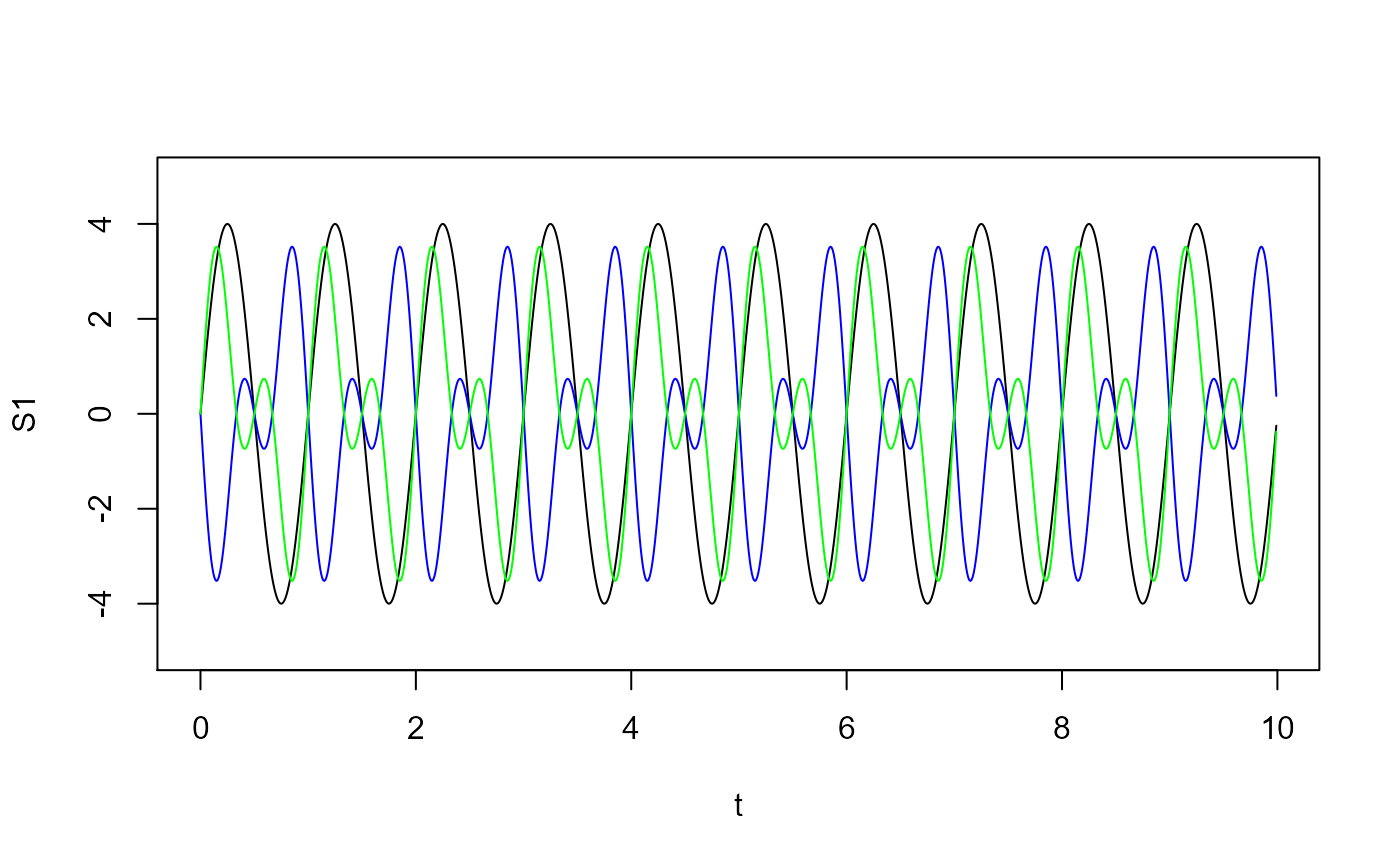
#Create a vector of time that represent times where data are sampled. Fs = 100; #sampling frequency in Hz T = 1/Fs; #sampling period L = 1000; #length of time vector t = (0:(L-1))*T; #time vector #First signal #1. 1 Hz with amplitude of 4 S1 <- 4*sin(2*pi*1*t) S1.data.frame <- as.data.frame(cbind(t, S1)) colnames(S1.data.frame) <- c("Time", "Signal") #Second signal #1. 1 Hz with amplitude of -2 #2. 2 Hz with amplitude of -2 S2 <- (-2)*sin(2*pi*1*t) - 2*sin(2*pi*2*t); S2.data.frame <- as.data.frame(cbind(t, S2)) colnames(S2.data.frame) <- c("Time", "Signal") #Third signal #1. 1 Hz with amplitude of 2 #2. 2 Hz with amplitude of 2 S3 <- 2*sin(2*pi*1*t) + 2*sin(2*pi*2*t); S3.data.frame <- as.data.frame(cbind(t, S3)) colnames(S3.data.frame) <- c("Time", "Signal") #Add all signals to a List list.of.windows <- list(S1.data.frame, S2.data.frame, S3.data.frame) results <- MakeCompositeXYPlotForAllWindows(list.of.windows, "Signal", 0, 999, 1) x.values <- results[[1]] y.values <- results[[2]] stddev.y.values <- results[[3]] #plot each xy plot individually #dev.new() plot(t, S1, ylim = c(-5, 5), type = "l")#plot the averaged plot #The only curve remaining should be the 1Hz with amplitude of 4/3. #dev.new() plot(x.values, y.values, type = "l")#Add error bars arrows(x.values, y.values, x.values, y.values + stddev.y.values, length=0.05, angle=90)#> Warning: zero-length arrow is of indeterminate angle and so skipped#> Warning: zero-length arrow is of indeterminate angle and so skipped#> Warning: zero-length arrow is of indeterminate angle and so skipped#> Warning: zero-length arrow is of indeterminate angle and so skipped#> Warning: zero-length arrow is of indeterminate angle and so skipped#> Warning: zero-length arrow is of indeterminate angle and so skipped#> Warning: zero-length arrow is of indeterminate angle and so skipped#> Warning: zero-length arrow is of indeterminate angle and so skipped#> Warning: zero-length arrow is of indeterminate angle and so skipped#> Warning: zero-length arrow is of indeterminate angle and so skipped#> Warning: zero-length arrow is of indeterminate angle and so skipped#> Warning: zero-length arrow is of indeterminate angle and so skipped#> Warning: zero-length arrow is of indeterminate angle and so skipped#> Warning: zero-length arrow is of indeterminate angle and so skipped#> Warning: zero-length arrow is of indeterminate angle and so skipped#> Warning: zero-length arrow is of indeterminate angle and so skipped#> Warning: zero-length arrow is of indeterminate angle and so skipped#> Warning: zero-length arrow is of indeterminate angle and so skipped#> Warning: zero-length arrow is of indeterminate angle and so skipped#> Warning: zero-length arrow is of indeterminate angle and so skipped#> Warning: zero-length arrow is of indeterminate angle and so skipped#> Warning: zero-length arrow is of indeterminate angle and so skipped#> Warning: zero-length arrow is of indeterminate angle and so skipped#> Warning: zero-length arrow is of indeterminate angle and so skipped#> Warning: zero-length arrow is of indeterminate angle and so skipped#> Warning: zero-length arrow is of indeterminate angle and so skipped#> Warning: zero-length arrow is of indeterminate angle and so skipped#> Warning: zero-length arrow is of indeterminate angle and so skipped#> Warning: zero-length arrow is of indeterminate angle and so skipped#> Warning: zero-length arrow is of indeterminate angle and so skipped#> Warning: zero-length arrow is of indeterminate angle and so skipped#> Warning: zero-length arrow is of indeterminate angle and so skipped#> Warning: zero-length arrow is of indeterminate angle and so skipped#> Warning: zero-length arrow is of indeterminate angle and so skipped#> Warning: zero-length arrow is of indeterminate angle and so skipped#> Warning: zero-length arrow is of indeterminate angle and so skipped#> Warning: zero-length arrow is of indeterminate angle and so skipped#> Warning: zero-length arrow is of indeterminate angle and so skipped#> Warning: zero-length arrow is of indeterminate angle and so skipped#> Warning: zero-length arrow is of indeterminate angle and so skipped