Generate a random forest model under cross validation (CV) for different subsets of the data and display results in a pheatmap to easily compare the different subsets
CVRandomForestClassificationMatrixForPheatmap.RdCVPredictionsRandomForest() is used on each subset of the data. For each subset of the data: A random forest model with a specified fold CV is generated. This random forest model is used to make a single column in the final matrix which can be used to generate a pheatmap. The inputted data should already have the rows shuffled. If LOOCV should be done on each subsetted data, then this can be indicated by using -1 for the number.of.folds.
CVRandomForestClassificationMatrixForPheatmap(
  input.data,
  factor.name.for.subsetting,
  name.of.predictors.to.use,
  target.column.name,
  seed,
  percentile.threshold.to.keep,
  number.of.folds
)
Arguments
| input.data | A dataframe which should already have the rows shuffled. |
|---|---|
| factor.name.for.subsetting | String to specify name of column to use for subsetting. The column should be a factor. Each column of the generated pheatmap will correspond to a level in the factor. |
| name.of.predictors.to.use | A vector of strings to specify name of columns to use as predictors for random forest model. Each column should be numeric. |
| target.column.name | A string to specify the column with values the random forest model is trying to predict for. The column should be a factor. |
| seed | A number to set for random number generation. |
| percentile.threshold.to.keep | A number from 0-1 indicating the percentile to use for feature selection. This is used by the CVPredictionsRandomForest() function. |
| number.of.folds | An integer to specify the fold for CV. If This number is set to -1, then the function will use LOOCV for each subset data set. |
Value
A list with three objects:
A numerical matrix that can be used for pheatmap generation.
A list of subset data sets for each column in the heatmap matrix.
A list of vectors containing the predictions for each column in the heatmap matrix. These values are used to calculate the MCC.
See also
Other Classification functions:
CVPredictionsRandomForest(),
GenerateExampleDataMachinelearnr(),
LOOCVPredictionsRandomForestAutomaticMtryAndNtree(),
LOOCVRandomForestClassificationMatrixForPheatmap(),
RandomForestAutomaticMtryAndNtree(),
RandomForestClassificationGiniMatrixForPheatmap(),
RandomForestClassificationPercentileMatrixForPheatmap(),
eval.classification.results(),
find.best.number.of.trees()
Examples
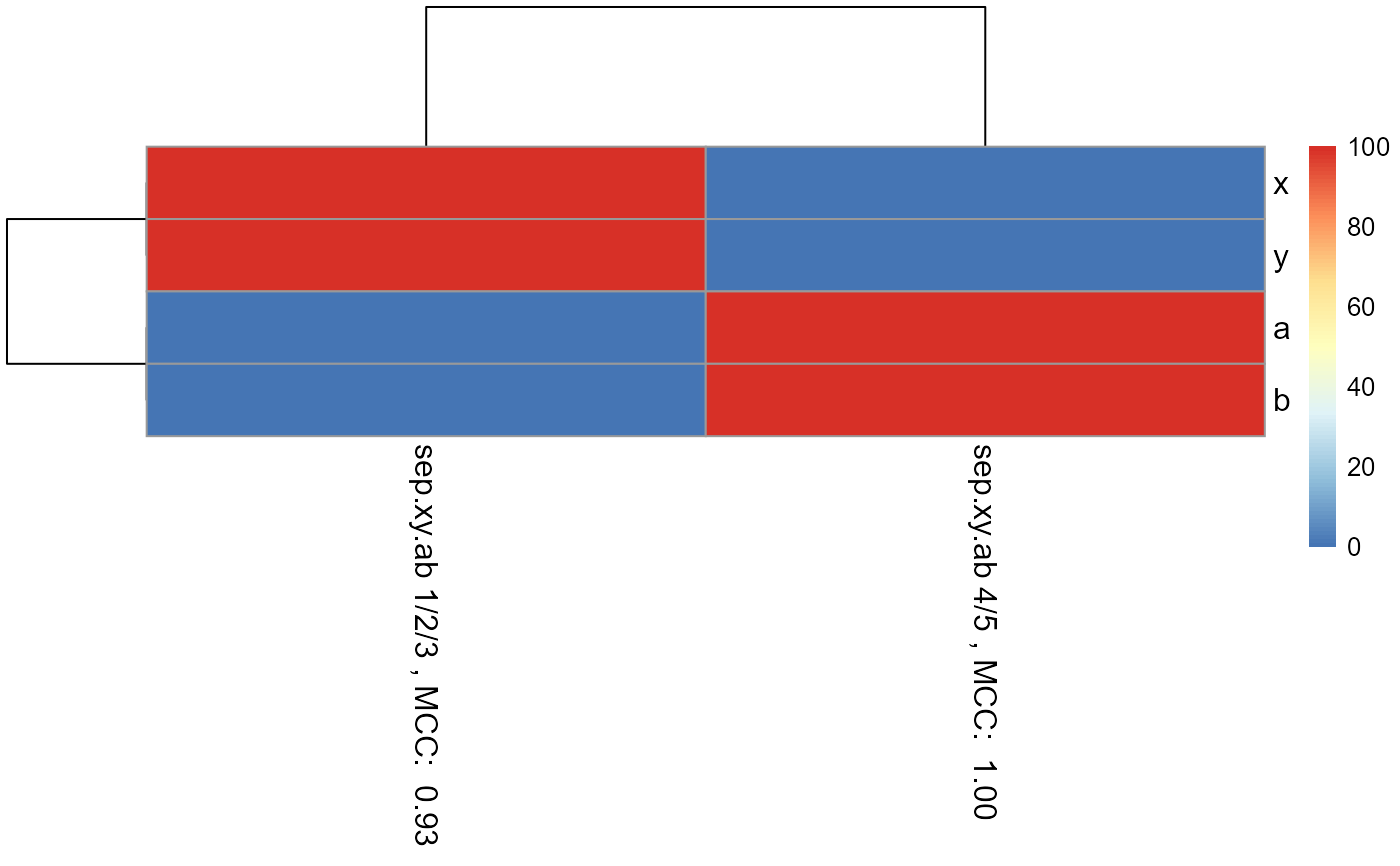
example.data <- GenerateExampleDataMachinelearnr() set.seed(1) example.data.shuffled <- example.data[sample(nrow(example.data)),] result.two.fold.CV <- CVRandomForestClassificationMatrixForPheatmap( input.data = example.data.shuffled, factor.name.for.subsetting = "sep.xy.ab", name.of.predictors.to.use = c("x", "y", "a", "b"), target.column.name = "actual", seed = 2, percentile.threshold.to.keep = 0.5, number.of.folds = 2)#> [1] 1 #> [1] 2 #> [1] 1 #> [1] 2matrix.for.pheatmap <- result.two.fold.CV[[1]] pheatmap_RF <- pheatmap::pheatmap(matrix.for.pheatmap, fontsize_col = 12, fontsize_row=12)